Over the last 3 months I have been working on Effective Quadratures (EQ), a Python library used to create polynomial approximations for computer models and data analytics. With funding from the Google Summer of Code (GSoC), I have been able to deliver upon my initial proposal of implementing a new class called PolyTree which is able to perform regression analysis. In this blog post I wish to document and justify the main decisions made as part of the development process, hopefully giving insight into what a GSoC project might look like.
Phase 1
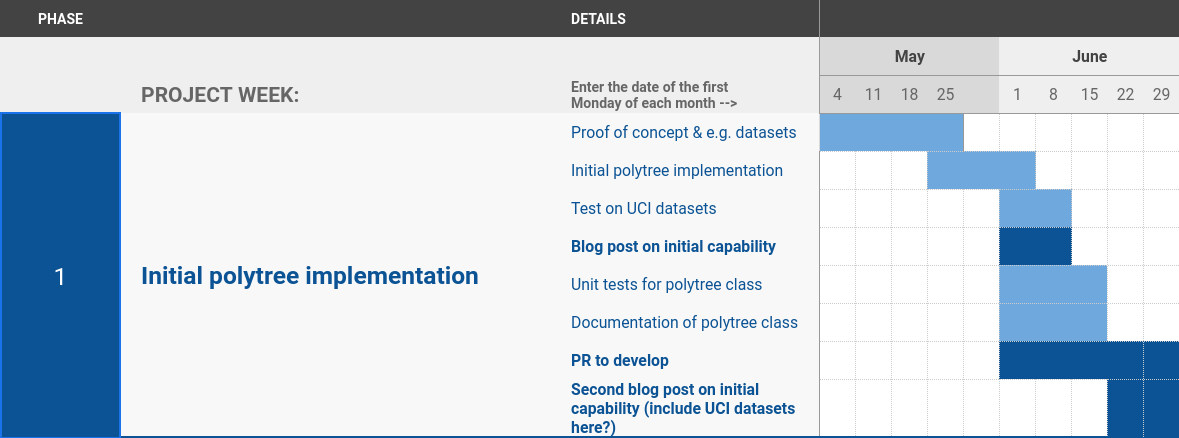
The first phase of the project is where the bulk of the programming over the course of the project was done. It began with familiarising myself with various papers and the implementations of model trees before experimenting with toy problems inside notebooks. These experiments turned out to be invaluable in later stages of the project as they built up my intuition for the common pitfalls encountered when modelling with polynomials.
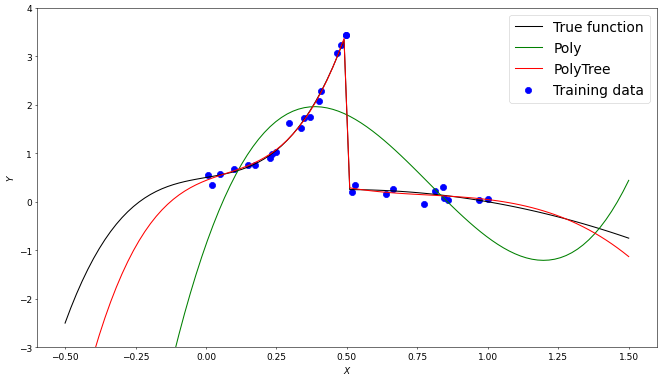
An image from my first blog post demonstrating an early 1 dimensional version of PolyTree
By the end of the first phase, significant progress had been made and we had met all the required deliverables set in the proposal. In my first pull request to the develop branch of EQ, the methods fit() and predict() had been implemented, tested and documented. Alongside development I also spent a significant amount of time working on visualisation with the goal being able to condense the essence of the project into a series of gif’s, something which greatly helped me when trying to explain to my parents what I was doing on my laptop all day.
Phase 2

Having finished all the proposal requirements, the month of phase 2 was spent addressing the issue of performance. When running PolyTree on large datasets it had become apparent that it wasn’t computationally feasible to fit many thousands of polynomials and so a more efficient split criterion had to be found. We ultimately decided to use a standard deviation split criterion used in the M5 algorithm seen below.
Polynomial loss Criterion: $\frac{N_L \cdot \text{PolyLoss}(X_L,y_L) + N_R \cdot \text{PolyLoss}(X_R,y_R)}{N}$
Standard Deviation Criterion: $\sigma(y)-\frac{N_L \cdot \sigma(y_L) + N_R \cdot \sigma(y_R)}{N}$
In the end we made the decision to include two different “tree types” in PolyTree. The first, tree_type="model_aware", would be for users who are either willing to wait or have a small dataset. Meanwhile tree_type="model_agnostic" would be used by someone dealing with “big data” who has limited resources and so is willing to accept a small compromise in the accuracy of their model. The “m5p” tree type differs not only in it’s split criterion but also in its construction, the tree is greedily expanded before being pruned back if no improvement in loss is made.
Phase 3
Having met the scope of the project in the first two phases, Phase 3 was spent ensuring the class was easy to use as well as competitive with state-of-the-art tree models. For example many optimisations, input validation and an adjustment of the default parameters were completed. Additionally we decided to separate out the pruning process in the “m5p” tree into a prune(X,y) method which could be used to prune any tree with held-out data, reducing the complexity of the model while maintaining or improving it’s accuracy.
Another feature added was smoothing. Instead of making a prediction from a polynomial in a terminal node, smoothing combines several predictions of parent node’s polynomials. When combined these two features make a significant improvement in the accuracy by improving upon the issue of over-fitting in the model.
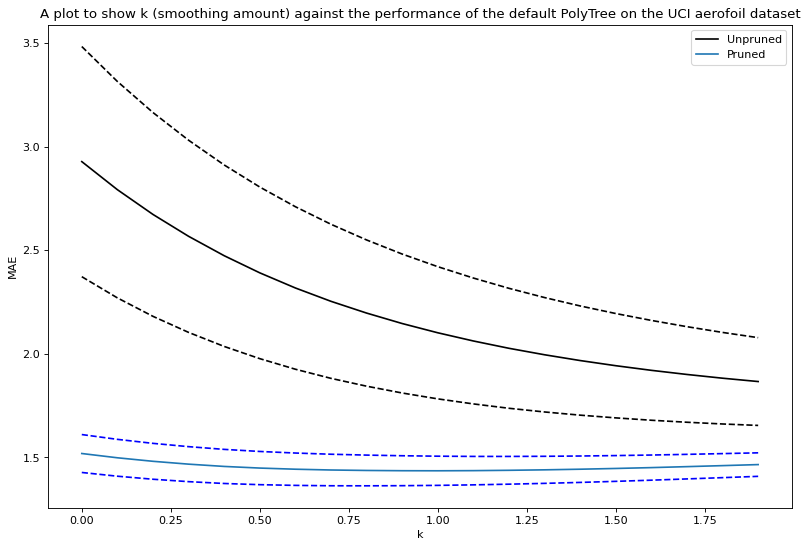
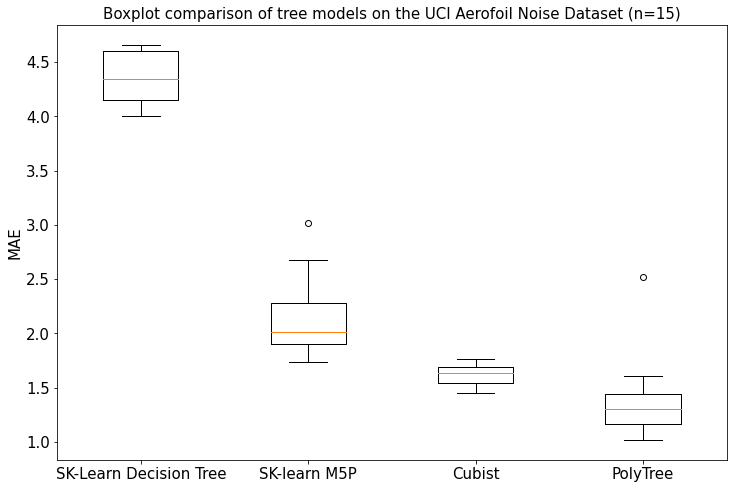
This plot was made from an average of 20 random train-prune-test data splits with the standard deviation represented by the dotted line
Future Work
In future work on the project I want to implement a method of automatically discarding training feature’s that have no effect on the output of the model. By reducing the number of training features, the cardinality of the basis used for the polynomials can be reduced which in turn means the tree will be able to achieve a lower minimum samples per leaf. Secondly by reducing redundant features, the polynomials will be more robust to noise in the data.
Thanks & Acknowledgements
I would like to give an enormous thank you to my mentors Pranay Seshadri, Ashley Scillitoe and Chun Yui Wong! Over the last 3 months we’ve met bi-weekly to discuss the project and there is absolutely no way I would’ve been able to do this project without their continual support. It’s been an absolute pleasure to work on Effective Quadratures and I look forward to continuing to contribute to the library.
Pull Requests to Effective Quadratures (develop)
- Polynomial Tree Class implementation by barneyhill · Pull Request #229 · equadratures/equadratures · GitHub
- Polytree Core Implementation by barneyhill · Pull Request #240 · equadratures/equadratures · GitHub
- Final GSoC PolyTree Pull Request by barneyhill · Pull Request #251 · equadratures/equadratures · GitHub
