This thread builds upon some prior work on the Weight class in equadratures. We introduced the ability to incorporate analytical probability distribution functions. Furthermore, even if the functions did not integrate to unity, a function that normalised the PDF was also added.
In the latest github commit (see below), the ability to form data-driven probability distributions has been added to the Weight class. A working example of this is shown below. First, we introduce some sample data.
import equadratures as eq
import numpy as np
import matplotlib.pyplot as plt
import seaborn as sns
sns.set(font_scale=1.5)
sns.set_style("white")
sns.set_style("ticks")

param1 = np.random.rand(1000)
param2 = np.random.randn(1200)
param3 = np.random.randn(1300)*0.3 - 0.5
param4 = np.random.randn(300)*0.1 + 3
data = np.hstack([param1, param2, param3, param4])
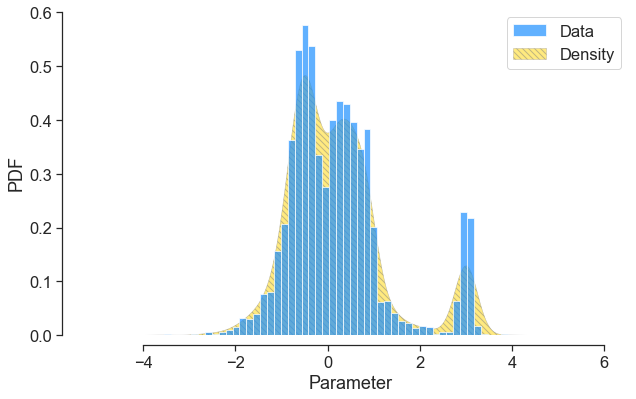
Next, we invoke the new Weight class, which uses scipy’s in-built kernel density estimation routine,
input_dist = eq.Weight(data, support=[-5, 6], pdf=False)
and pass this distribution instances to the Parameter class:
s = eq.Parameter(distribution='data', weight_function=input_dist, order=3)
s_values, pdf = s.get_pdf()
s_values, cdf = s.get_cdf()
s_samples = s.get_samples(6000)
Finally we plot!
fig = plt.figure(figsize=(10,6))
ax = fig.add_subplot(1,1,1)
plt.fill_between(s_values,  pdf*0.0, pdf, color="gold" , label='Density', interpolate=True, hatch="\\\\\\\\", edgecolor="grey",  linewidth=0.5,alpha=0.5)
plt.hist(data, 50, density=True, facecolor='dodgerblue', alpha=0.7, label='Data', edgecolor='white')
plt.xlabel('Parameter')
plt.ylabel('PDF')
plt.legend()
sns.despine(offset=10, trim=True)
plt.show()
Now, what’s nice is that we can truncate the data to a tighter support. So for instance, we set
input_dist = eq.Weight(data, support=[0, 6], pdf=False)
and then re-run the code block above, we obtain
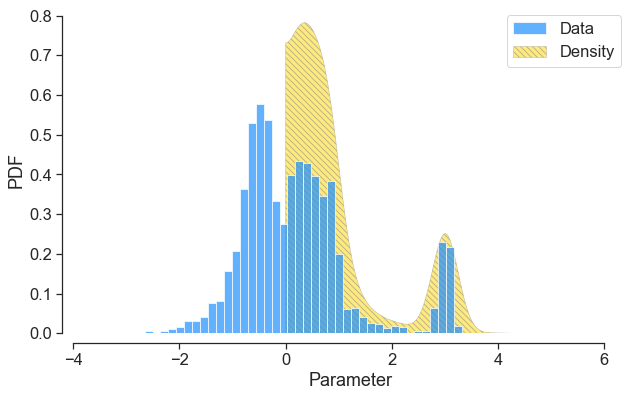
This addition has been added to the feature branch below. In this next few threads, I will comment on why using this within a regression context can be very useful.