Hi @DiegoLopez. I’ve had a first attempt at this. Given the few datapoints you have, I’ve only be able to apply linear regression trees. My original thought process was that once we have polynomials defined over each node, we can then compute their active subspace. This is possible because regression trees output a series of Poly instances, which can then be fed into the Subspace class.
For the former, see the code below:
import equadratures as eq
import pandas as pd
import numpy as np
import matplotlib.pyplot as plt
data = pd.read_csv('dataset.csv')
N, d = data.shape
input_var_names = ['v'+str(i) for i in range(1, d-2)]
X = pd.DataFrame(data, columns=input_var_names).values
tree_1 = eq.PolyTree(splitting_criterion='loss_gradient', order=1)
tree_1.fit(X,data['qoi1'].values)
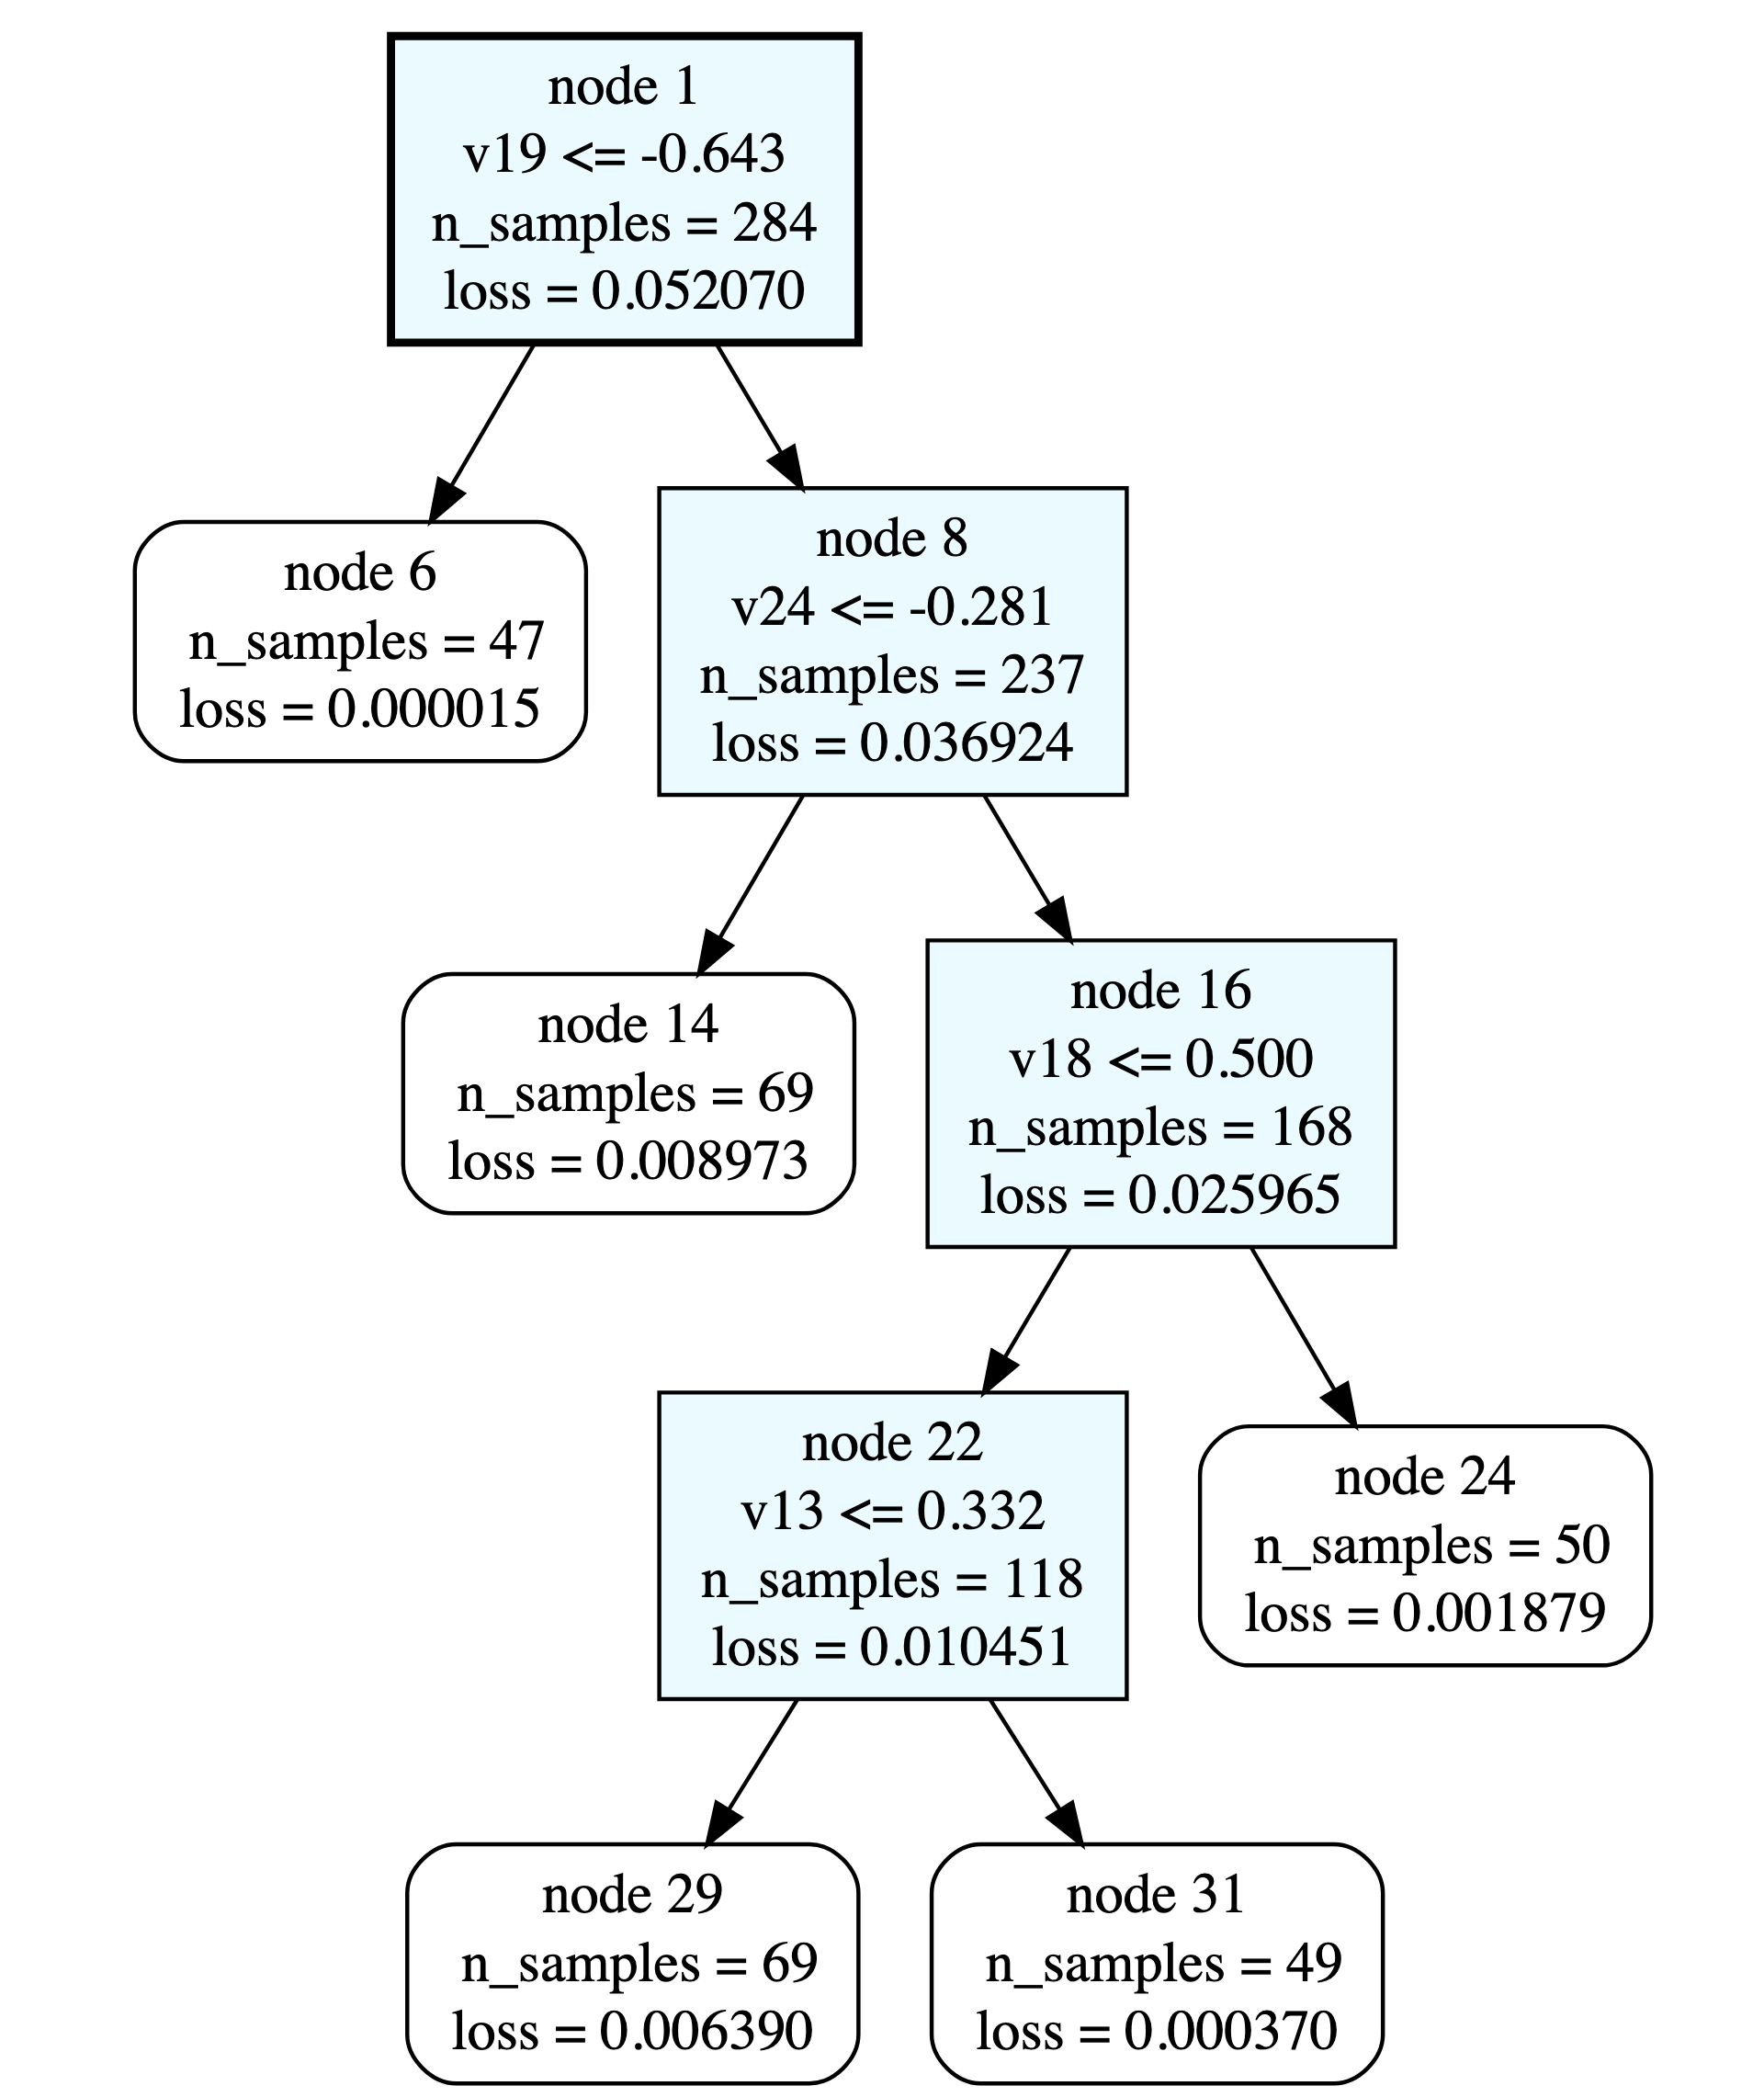
tree_1.get_splits()
This should return:
[[-0.6428257804365949, 18],
 [-0.2806524228882106, 23],
 [0.5000000092592589, 17],
 [0.3320158013032749, 12]]

individual_polys = tree_1.get_polys()
individual_polys
This should return a list of polynomials:
[<equadratures.poly.Poly at 0x1329a0250>,
 <equadratures.poly.Poly at 0x132c122e0>,
 <equadratures.poly.Poly at 0x132324c70>,
 <equadratures.poly.Poly at 0x132cc7310>,
 <equadratures.poly.Poly at 0x132c4f670>]
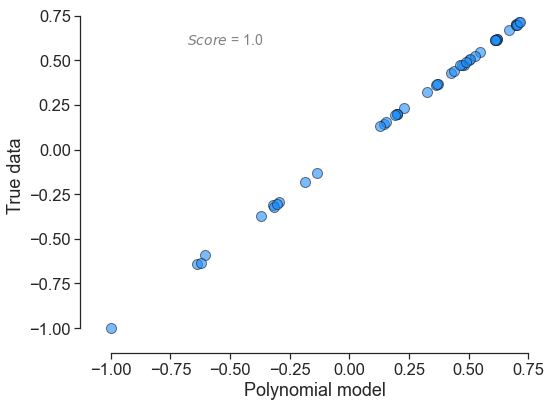
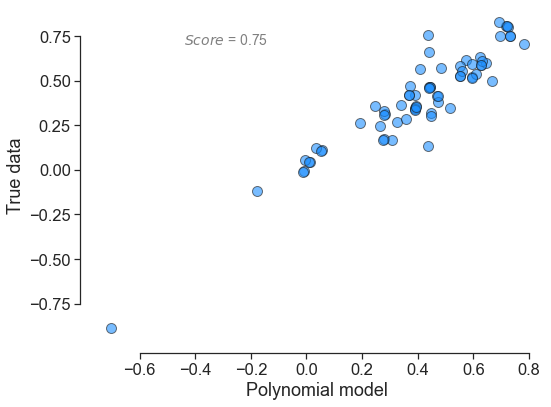
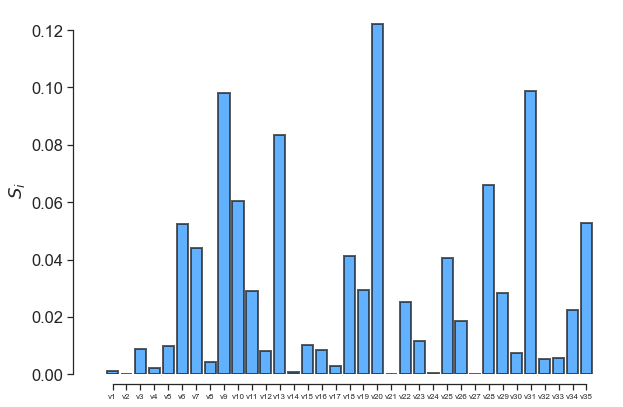
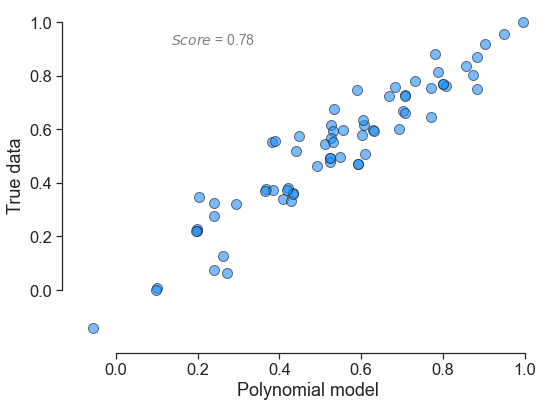
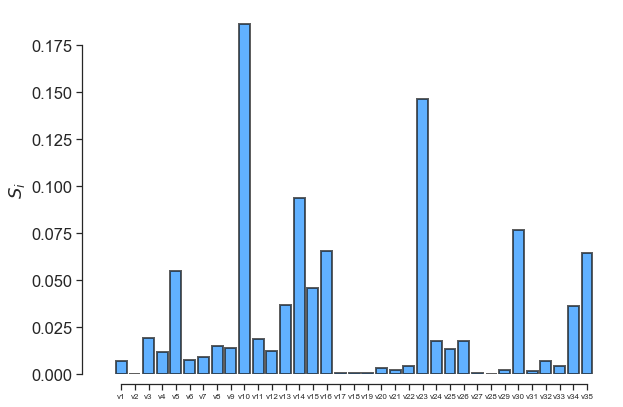
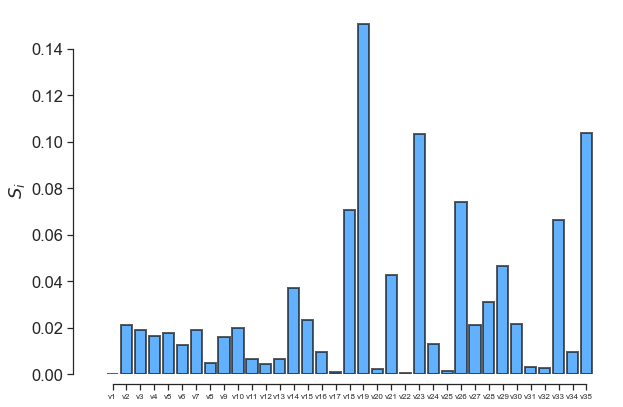
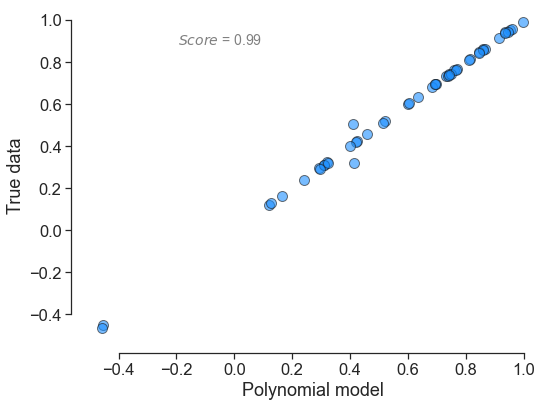
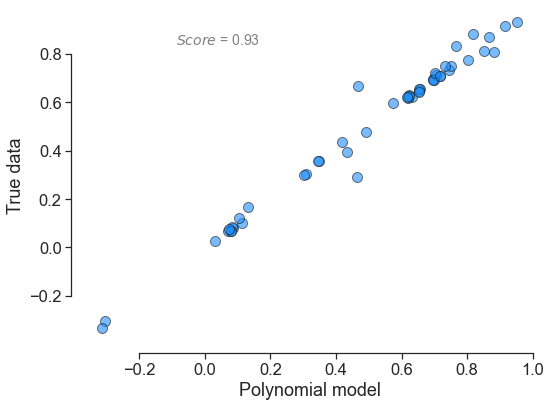
In terms of output, here is what each polynomial looks yields:
for little_polys in individual_polys:
little_polys.plot_model_vs_data()
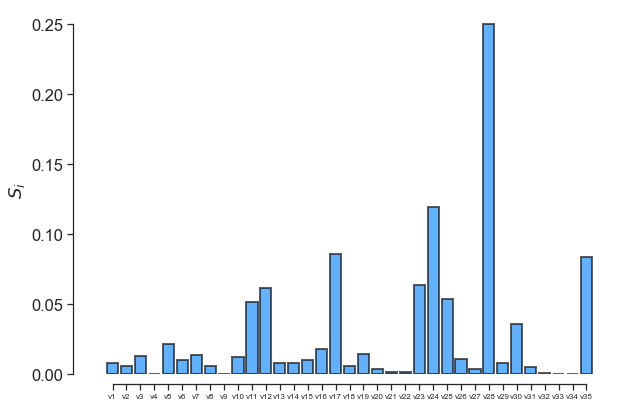
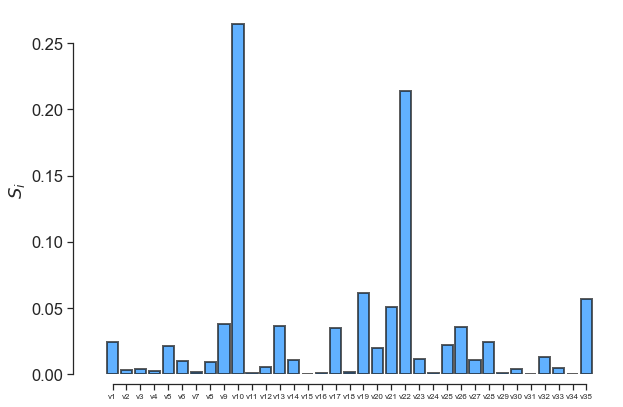
fig, ax = little_polys.plot_sobol(order=1, show=False)
ax.set_xticklabels(input_var_names, fontsize=8)
One can also use the online GraphViz tool to view the tree structure:
So what do we do next? My suggestion would be to see if you can generate more data / simulations, and also see if there is a strong physical rationale for the split locations. Hope this helps.